Scanning VS. Leveling
For new clients it is always important to know how can we improve their workflow quality and ensure reliable accuracy of our services. So we decided to give some practical examples of how we can evaluate an accuracy of our services.
We took three projects. One is ongoing asphalt reconstruction under Yellow Fidic, one is finishd and one is done for our own research purposes.
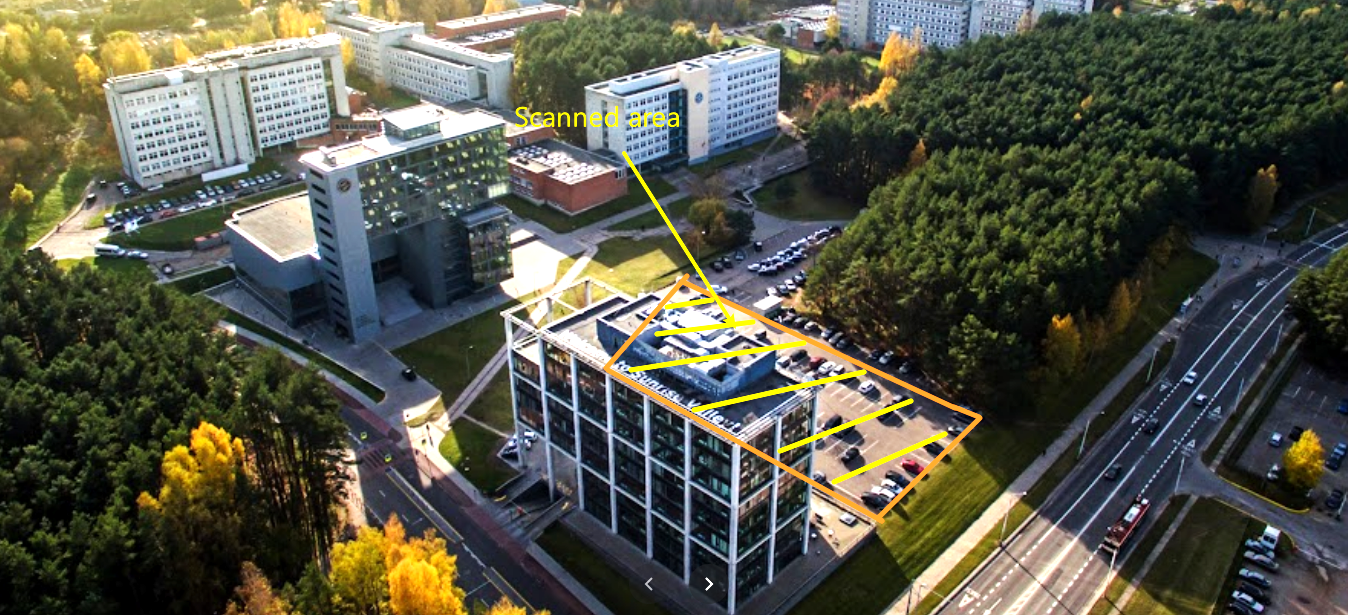
SUNRISE VALLEY SCIENCE & TECHNOLOGY PARK, LITHUANIA
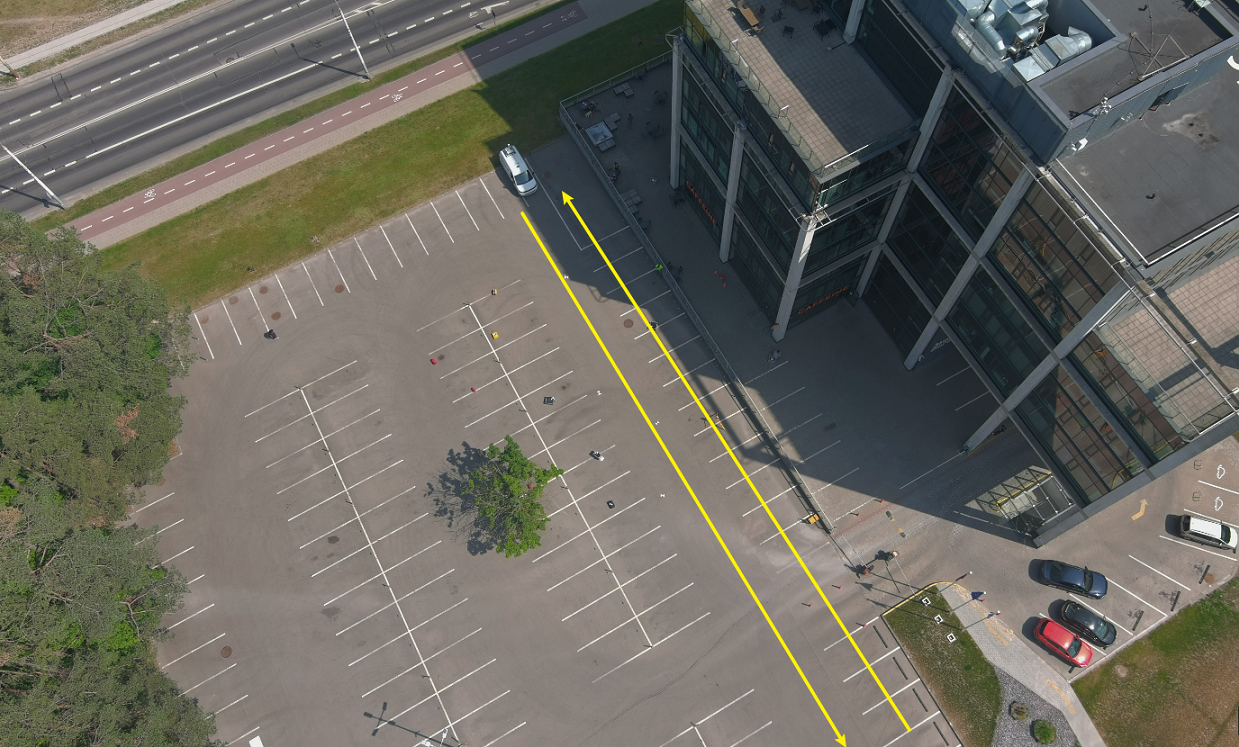
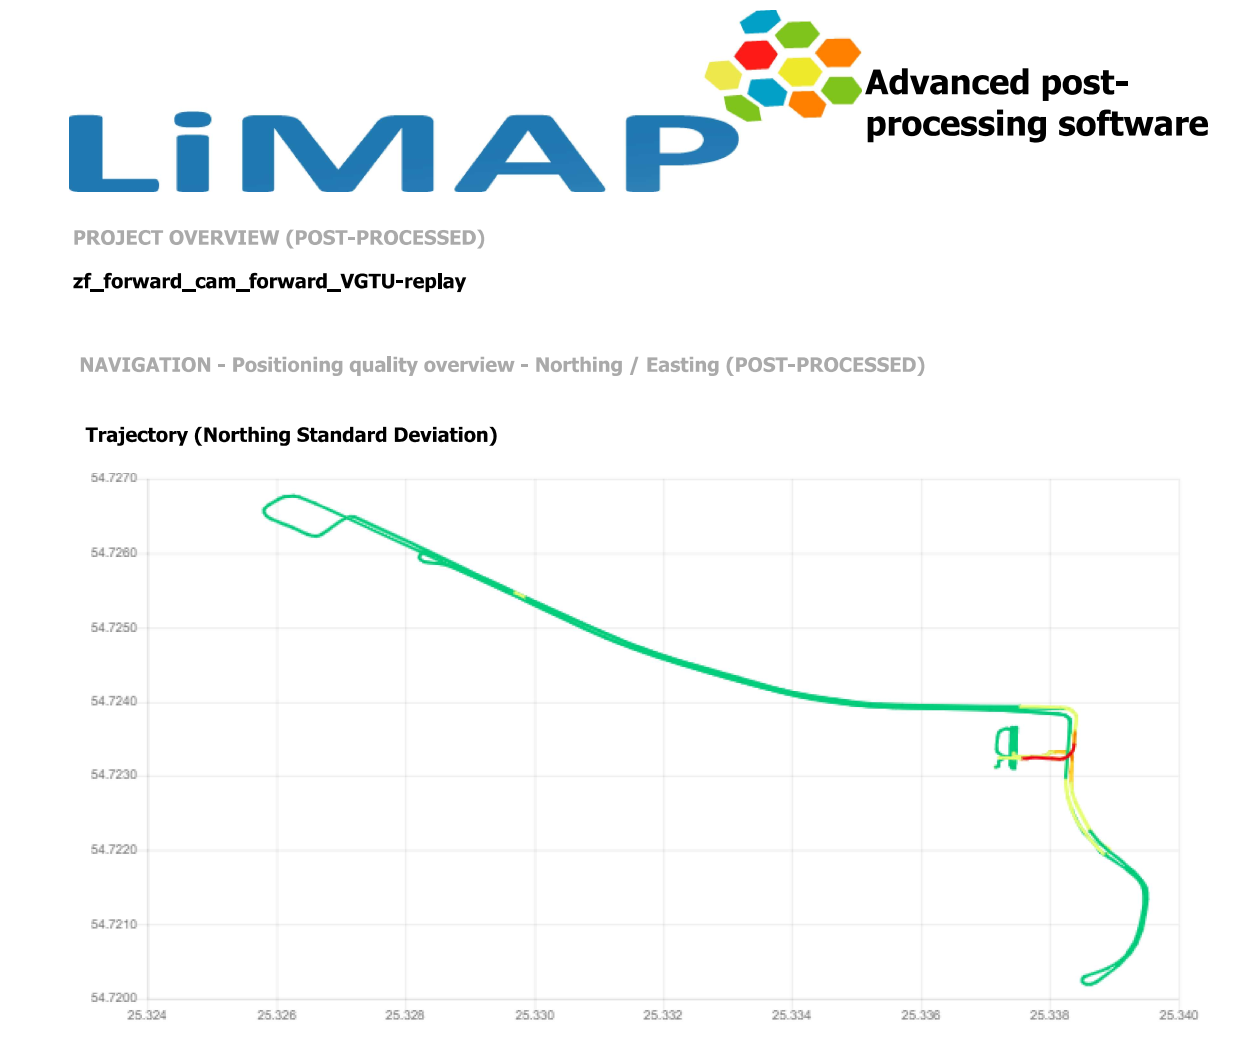
It was done for LIDAR data analysis purposes. This is an area near Sunrise Valley Science and Technology park, LiMAP head office. WGS84 coordinate – 54.7233, 25.3375.
Situation description: near the project area from the East side stands an 8 floors building with glass material and can cause unreliable signals of the GPS unit, which is integrated into the mobile mapping system. From the West side stands a 15 m height forest area.
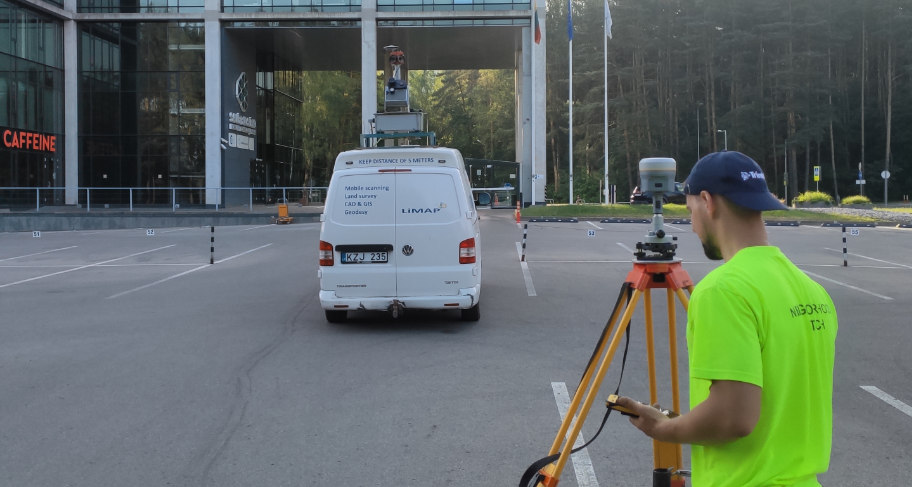
In this project we have done 2 scans, forward and backward. Usually we do 2 runs only on the projects where there is no need for a high precision data. More runs, more precise data we get. Both scans were done as close as possible to the building to be sure that the condition of the survey was lower than medium.
Base station: Our own base station was used. For this one we used the Trimble R12 GNSS unit, which can track all the available satellite signals.
Every drive-by is individual and is different. No two measurements in geodesy will ever be the same. Those rules apply for mobile mapping as well. For each project we match both or more drive-bys and decrease the possibility of an error.
For the traditional survey we used total station Leica TCRM 1203+. Measurements were done in the LKS-94 coordinate system. Total station was orientated on the resection method to 6 base points, which were done on a RTK GPS method, 60 sessions / 3 times a day, results averaged. All control points (CP) on the perpendicular surface were measured with RL function, others with Leica mini prism 360 GRZ101. Using this methodology, CP should reach a precision of +-2 mm, accuracy +-15 mm.
Results after Control Points was applied:
Average dz -0.000 Average magnitude 0.001
Minimum dz -0.002 Root mean square 0.001
Maximum dz +0.003 Std deviation 0.001
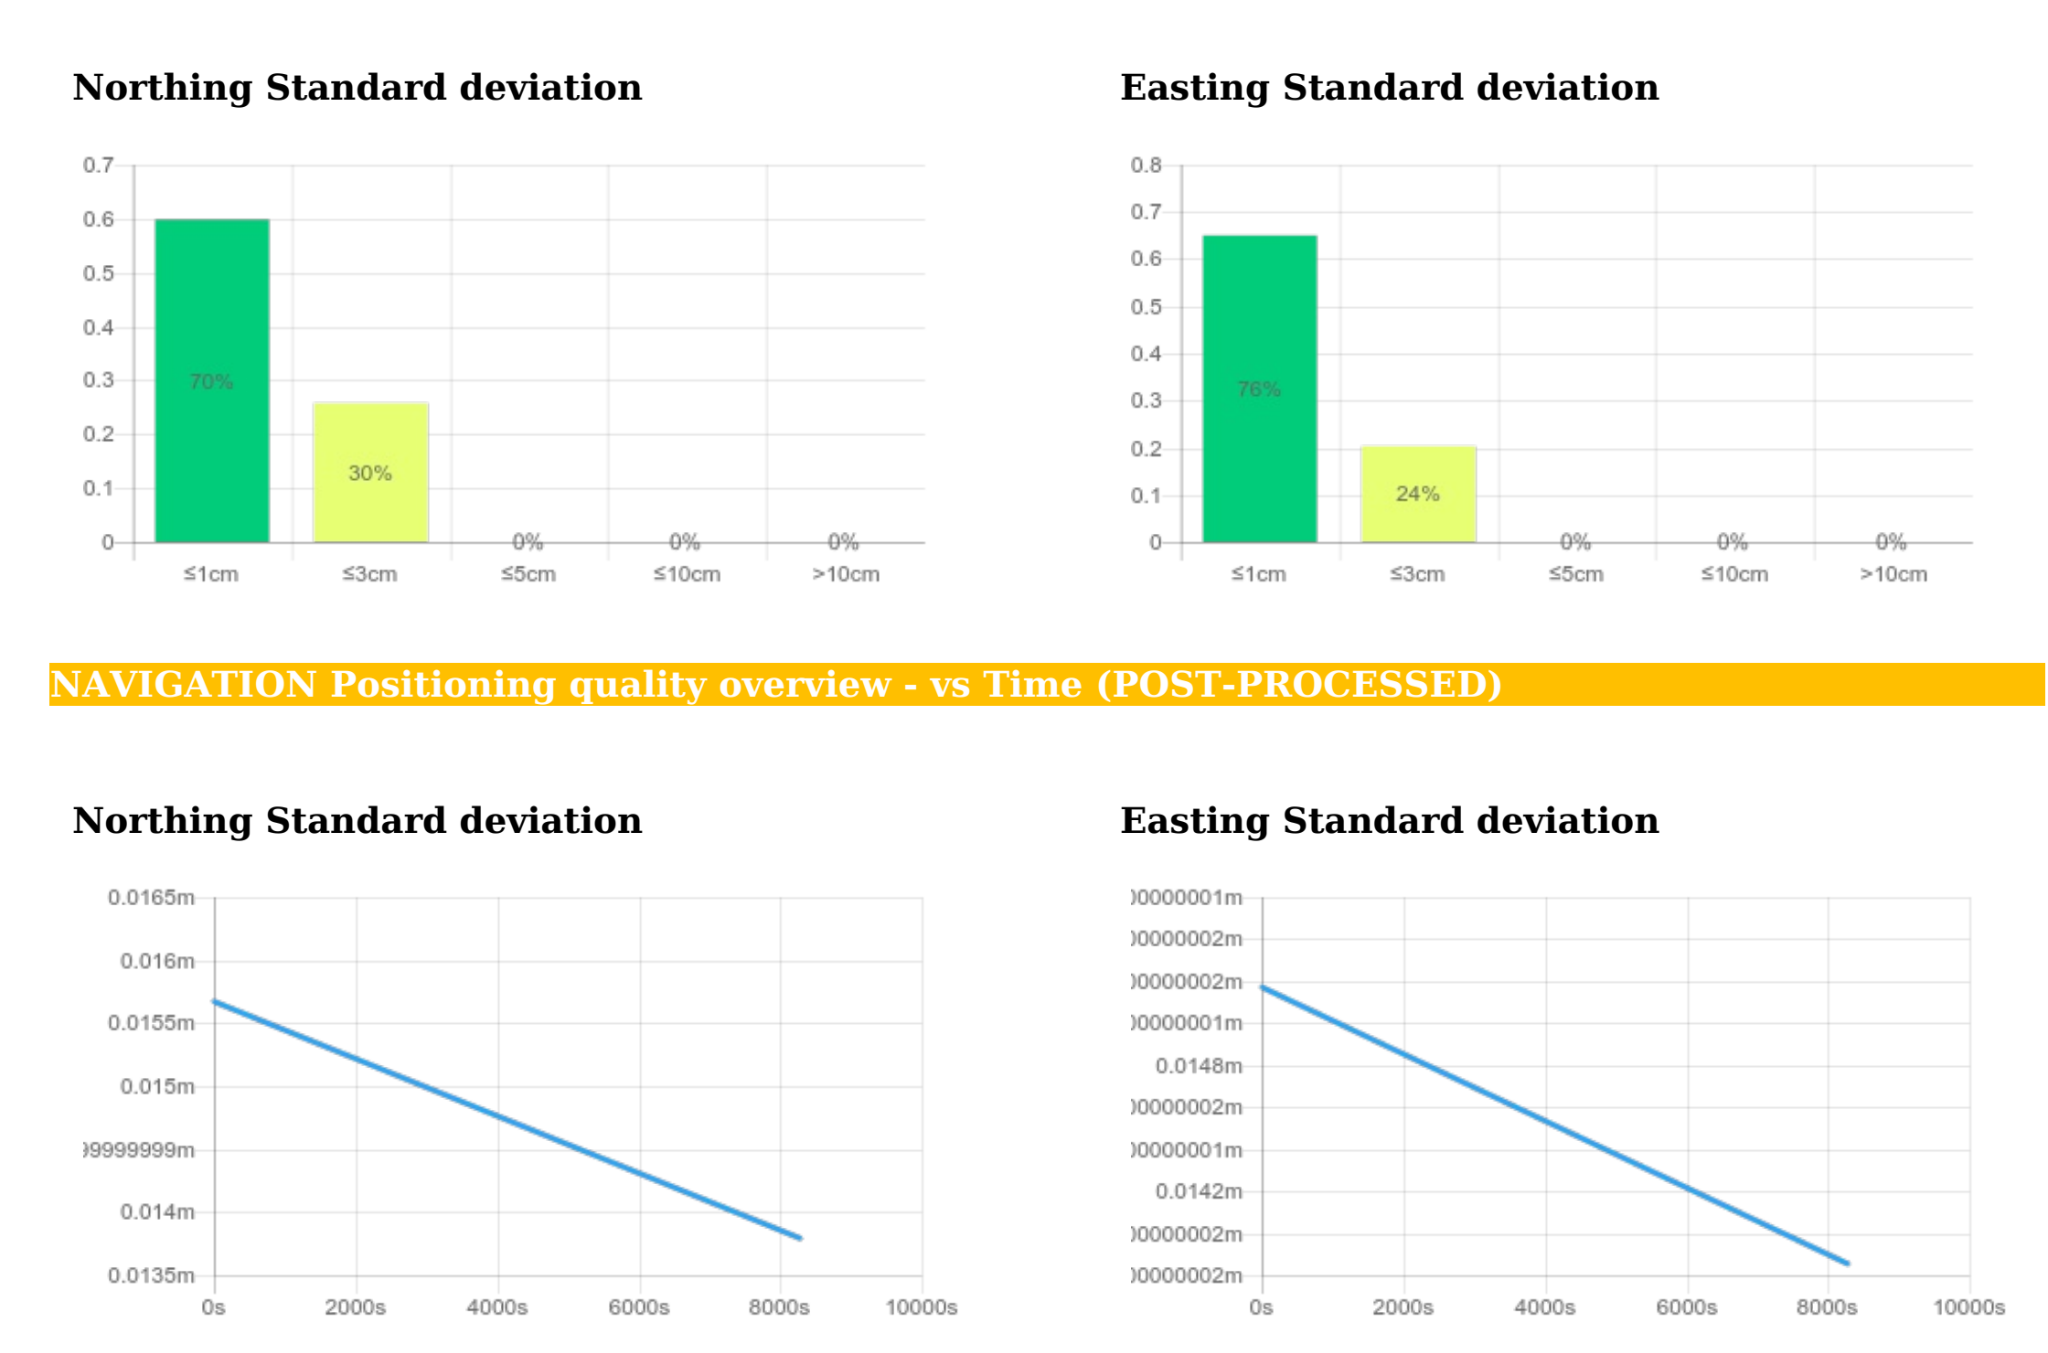
STATE MAIN ROAD 6 VALGA – UULU KM 10,019-24,714, ESTONIA
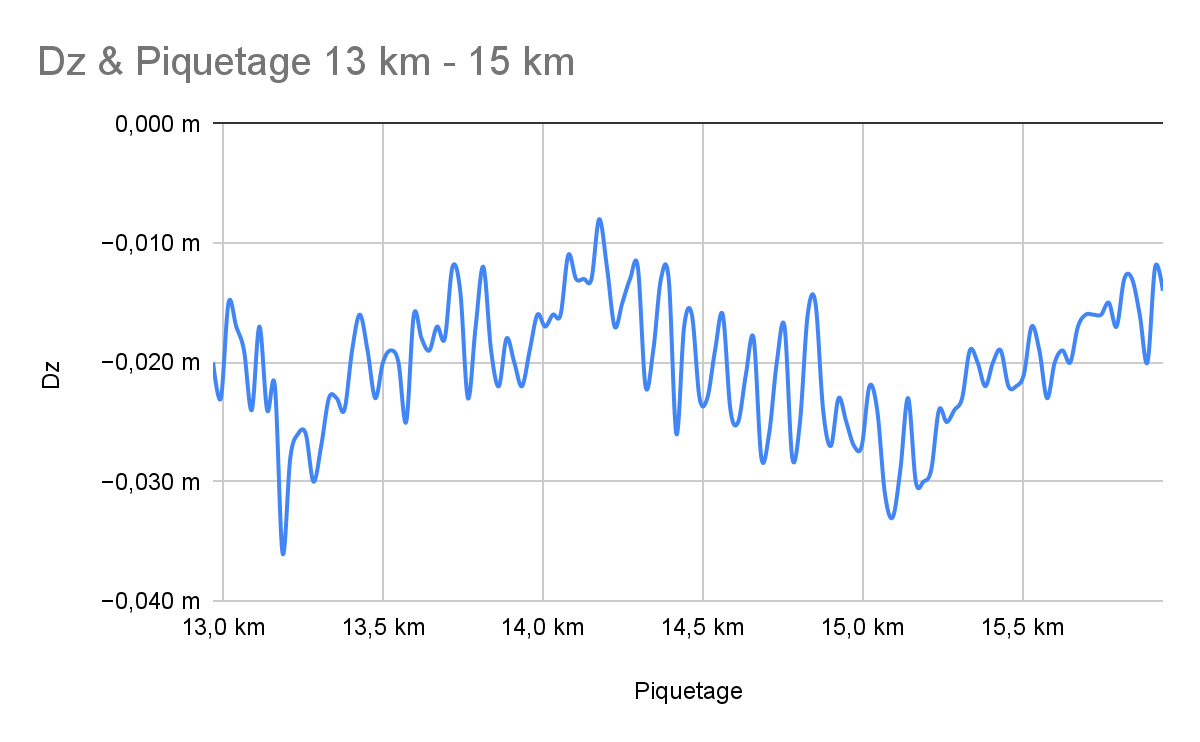
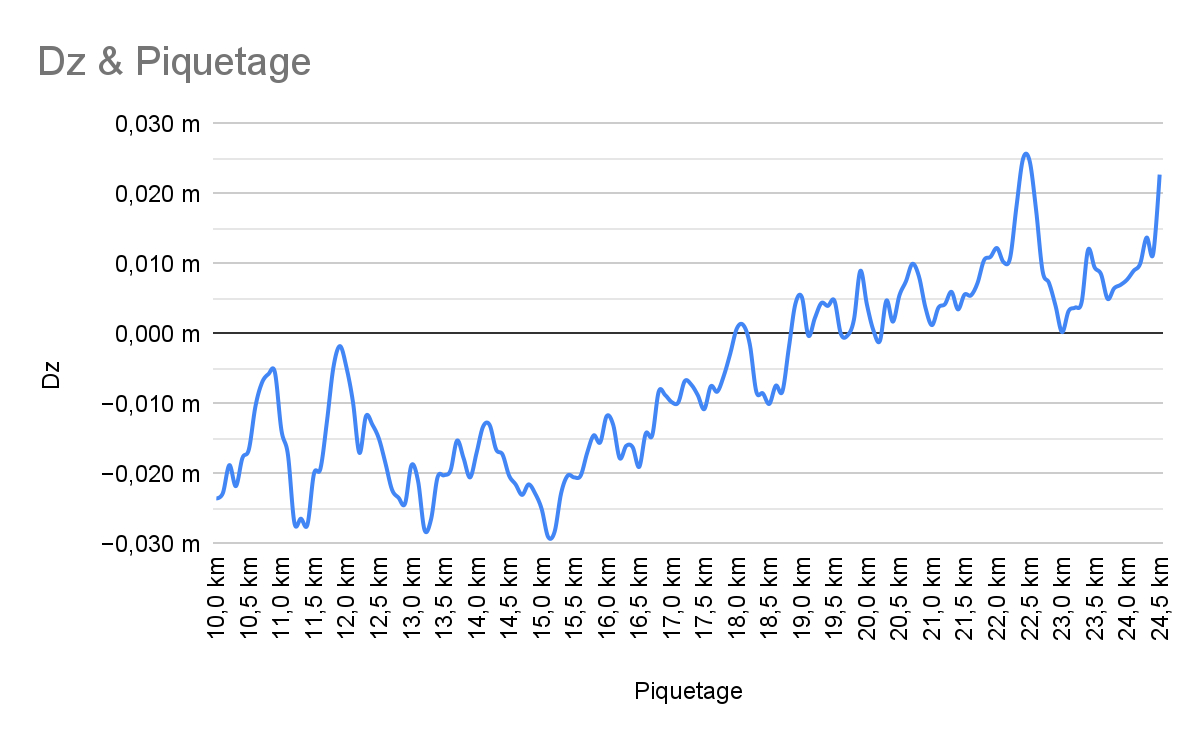


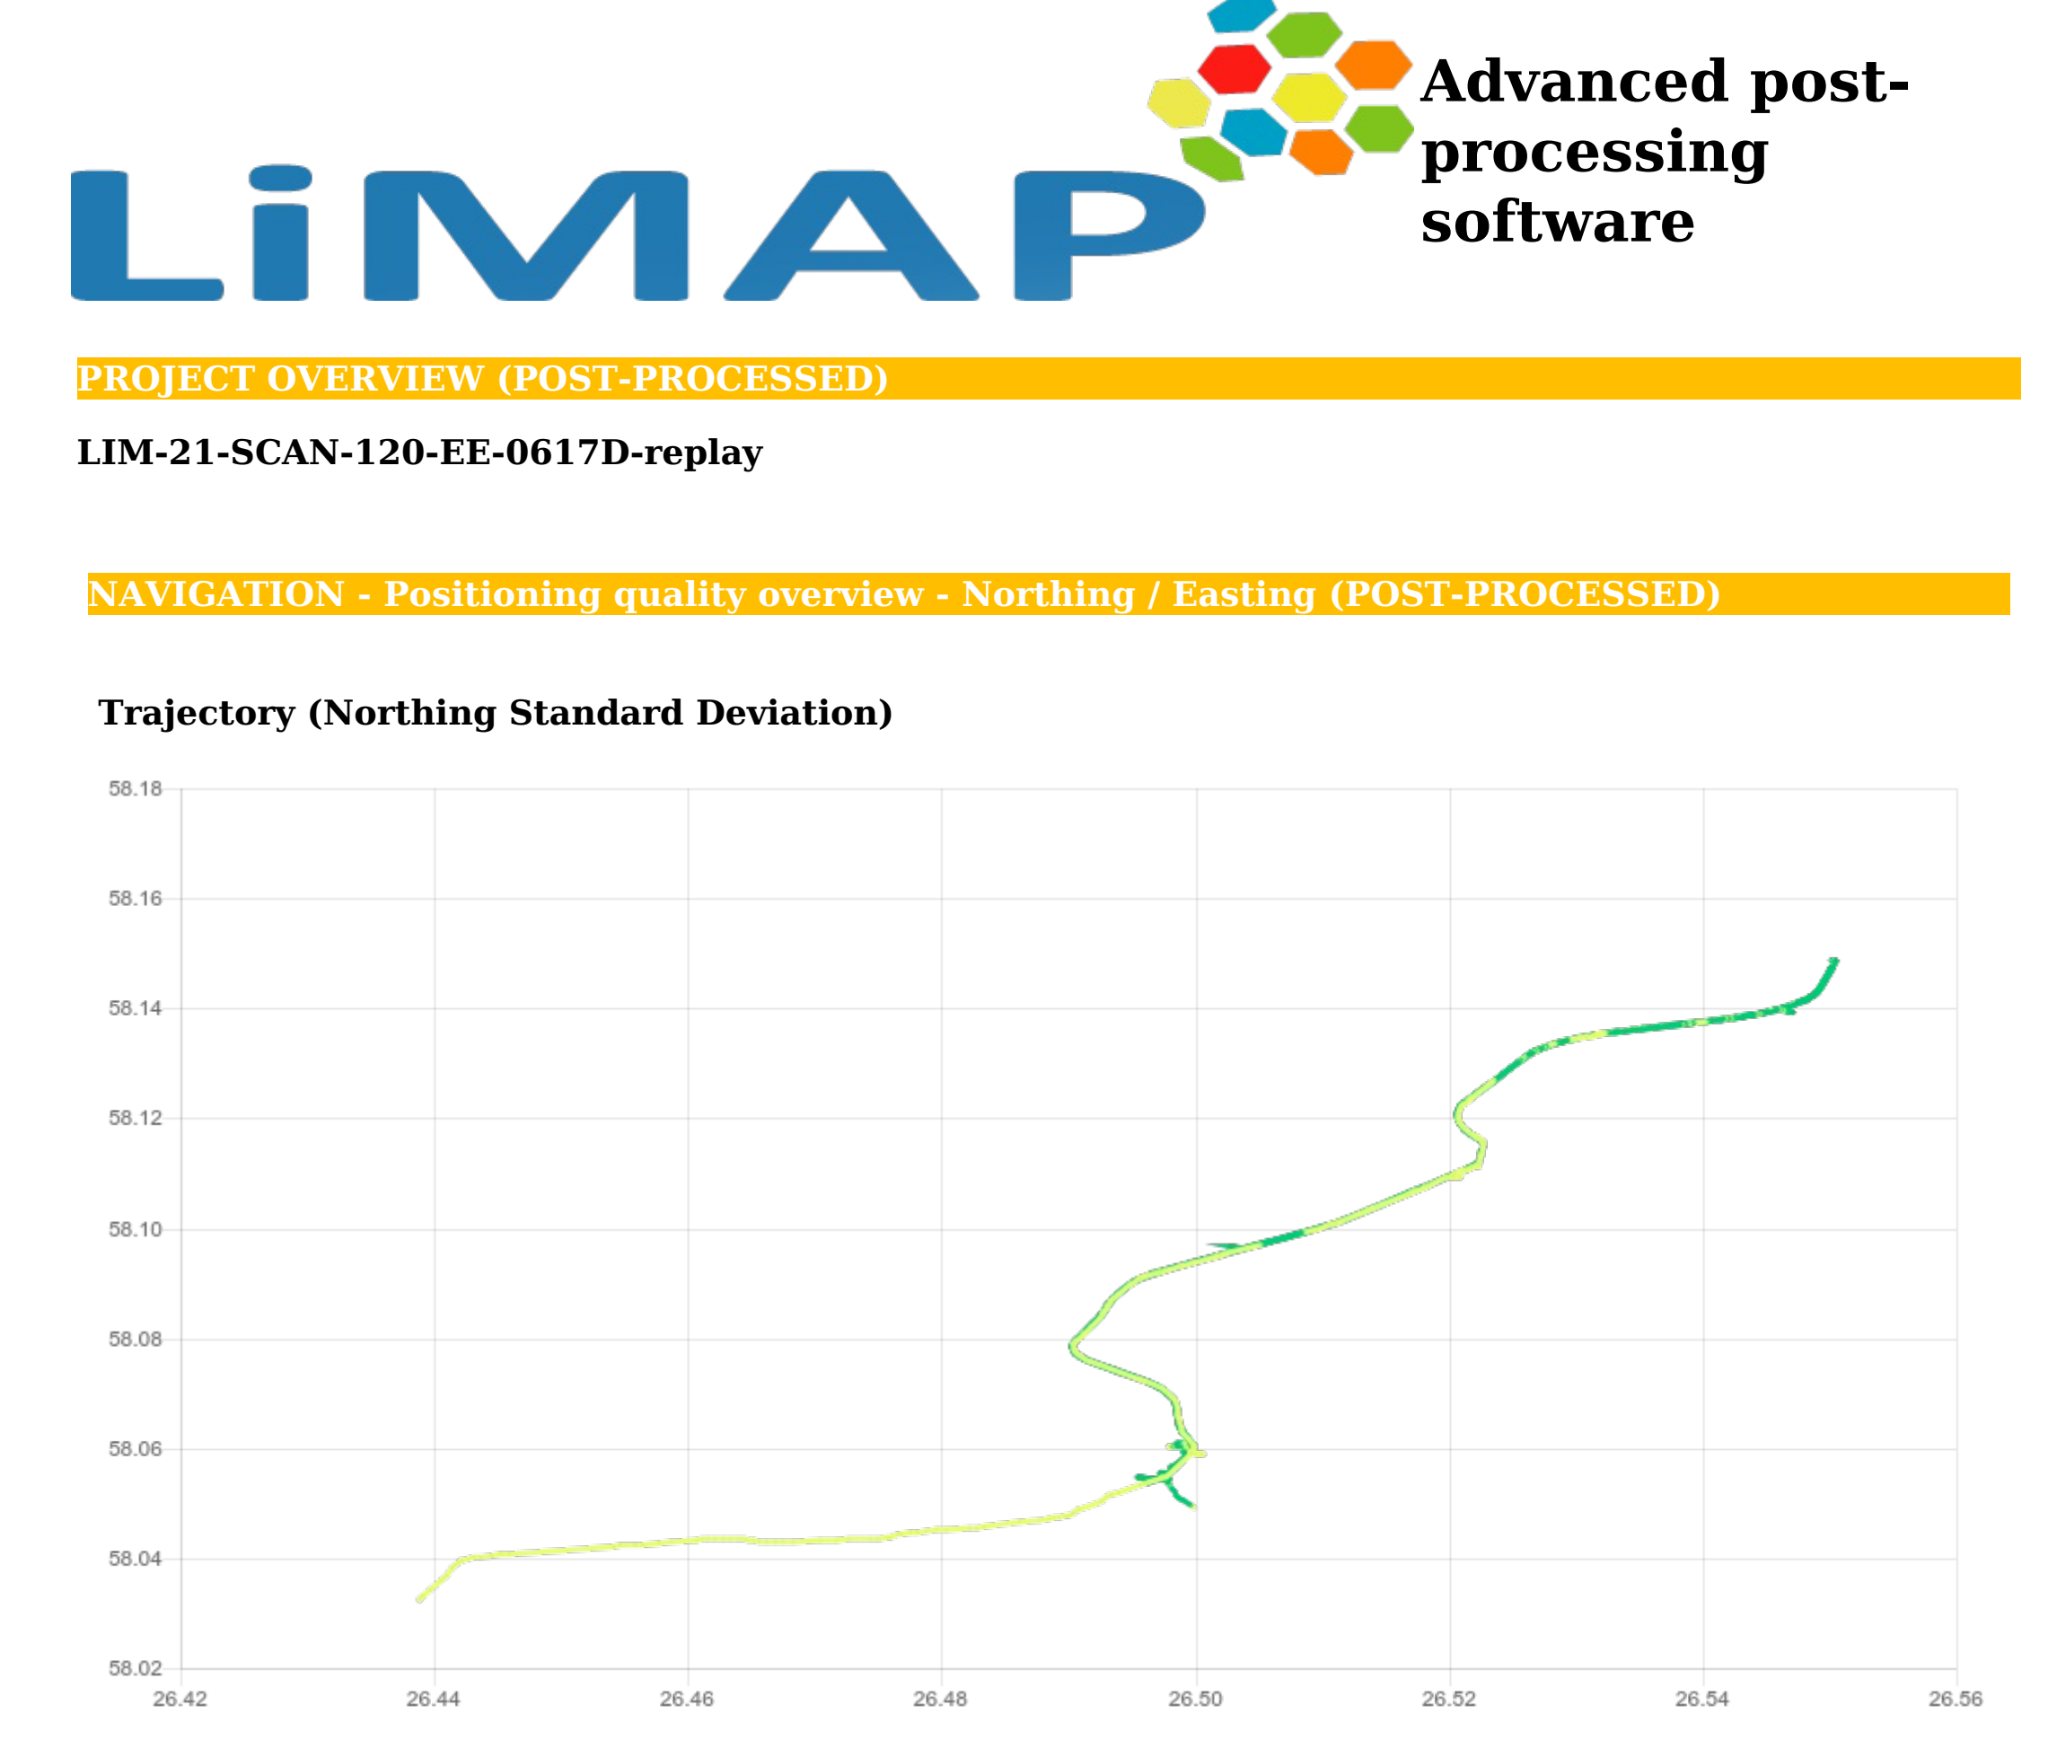

Customer of this project: one of the biggest Estonian road construction companies. This is an area located near the Latvia and Estonia border. WGS84 coordinate – 57.9254, 26.0091.
Situation description: length of project is more than 14 km. More than 80 % of the situation is a wide-open area, the other 20% are covered with forest and big trees.
In this project we have done 6 scans of which 3 forward and 3 backward. We are doing 6 scans where higher precision is required.
Base station: we have used a public GPS base station, which can track GPS and Glonass signals. Distance to the base station was around 30 km.
Every drive-by is individual and is different. No two measurements in geodesy will ever be the same. Those rules apply for mobile mapping as well. For each project we match both or more drive-bys and decrease the possibility of an error.
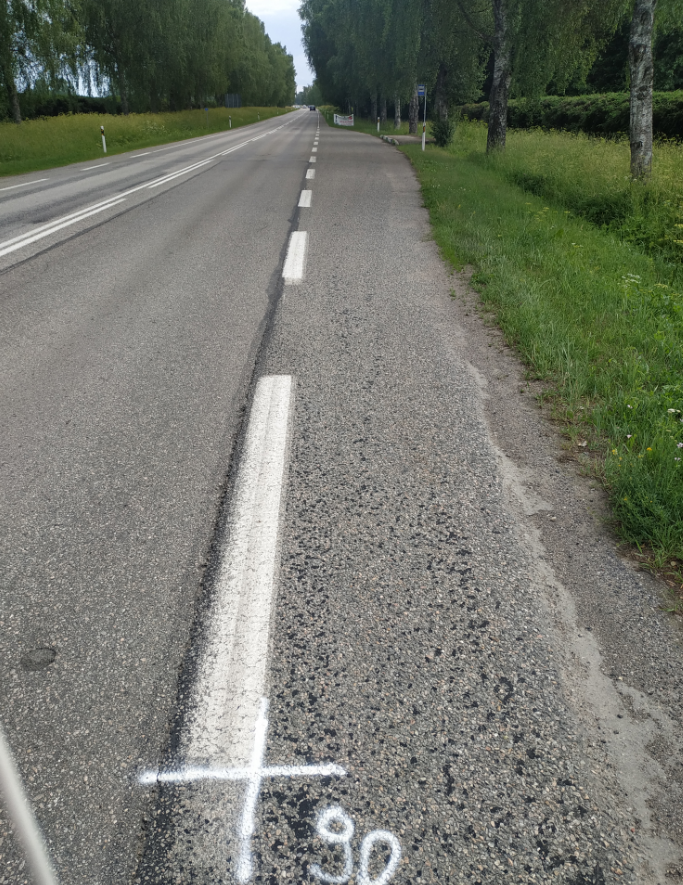
For this task we have chosen a levelling method combined with RTK solution. It was extremely important to get the best results in elevation. We used a Leica sprinter 250M. Levelling points were marked with paint on asphalt every 50 m by sections. 1 point on each roadside. Levelling was done in both ways Forward and Backward. It was divided into 4 parts to get the best results. Final accuracy was reached 2 mm on elevation. To measure XY values, a GPS unit was used.
To eliminate MLS data mismatch to leveling data we are using leveling points to force point cloud data into precise position. With specialized software MLS data and leveling data are being matched in sophisticated ways. It is not a straight line force match, but instead software takes into consideration accuracy of point cloud trajectory and uses weighted force displacement.
After combining results MLS and leveling data, report:
Average dz -0.000 Average magnitude 0.001
Minimum dz -0.002 Root mean square 0.001
Maximum dz +0.002 Std deviation 0.001
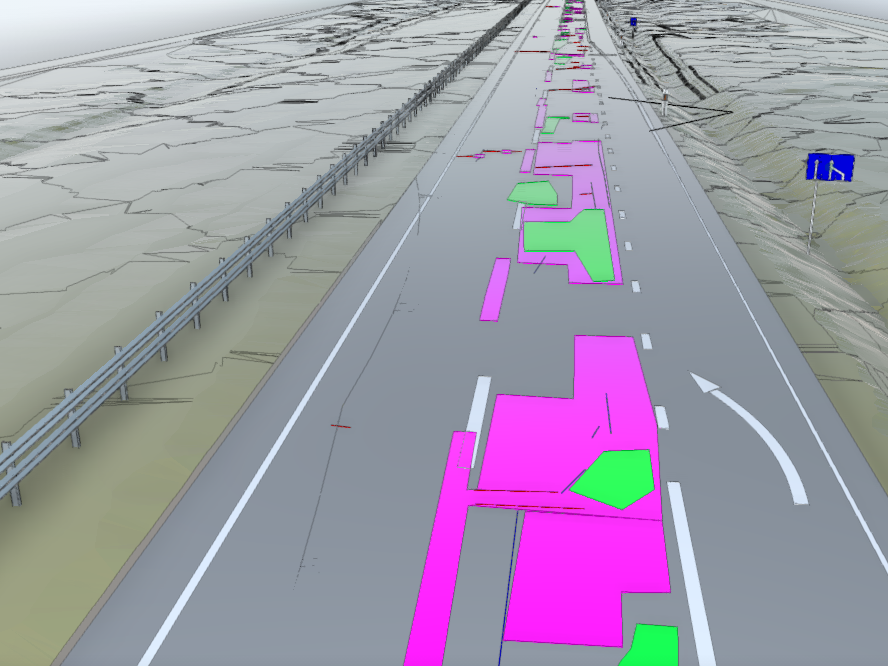
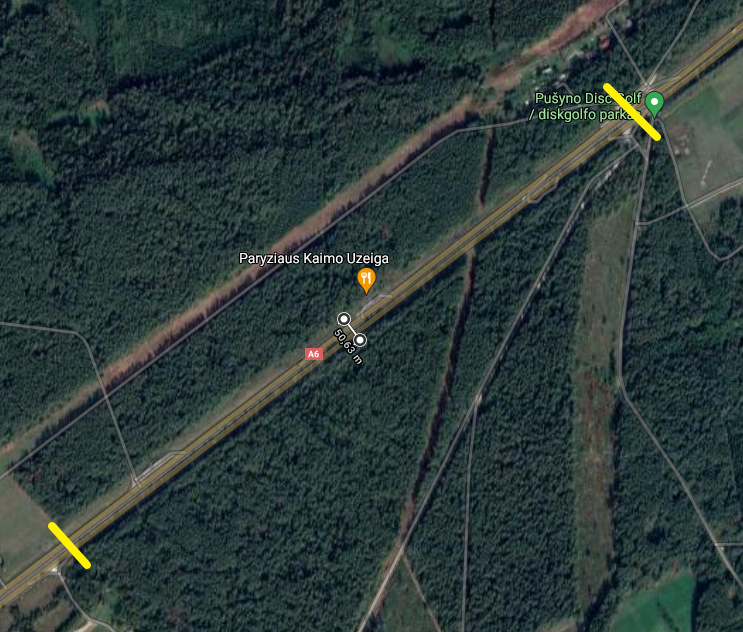
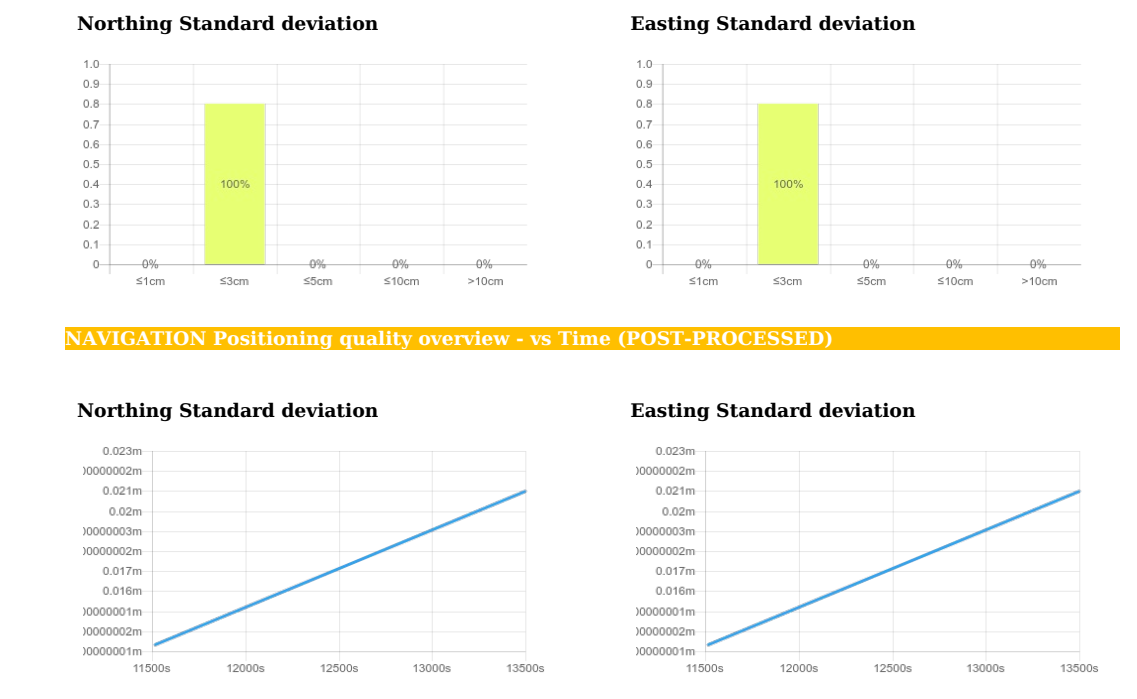
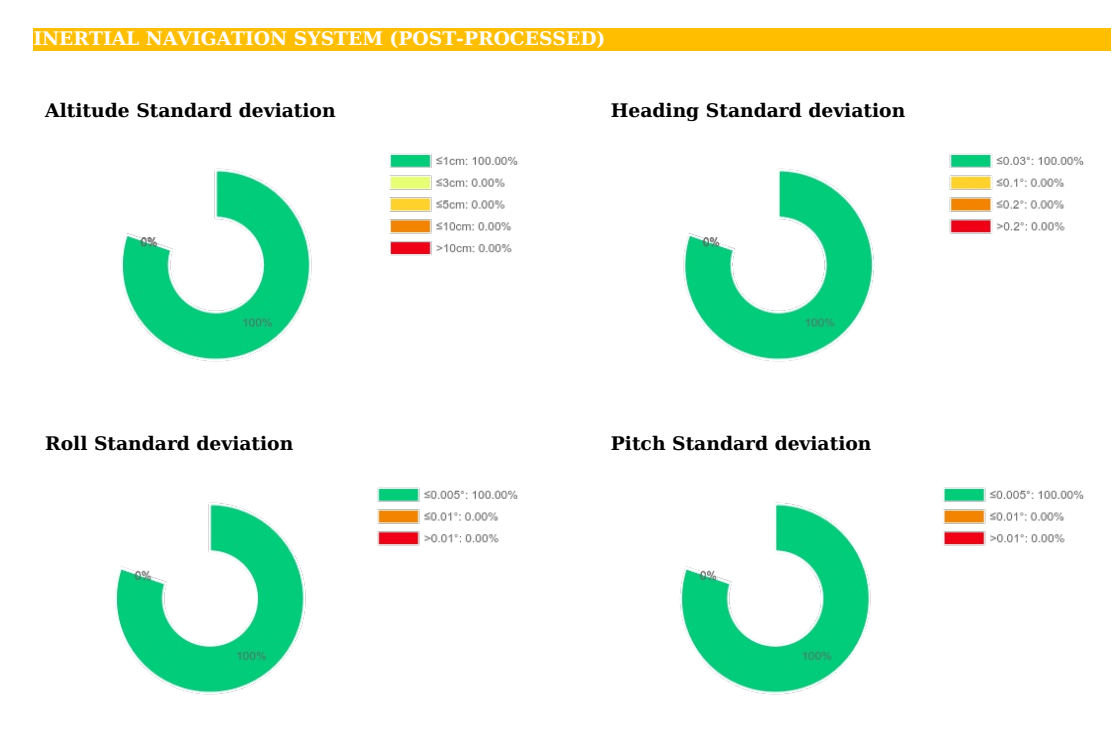
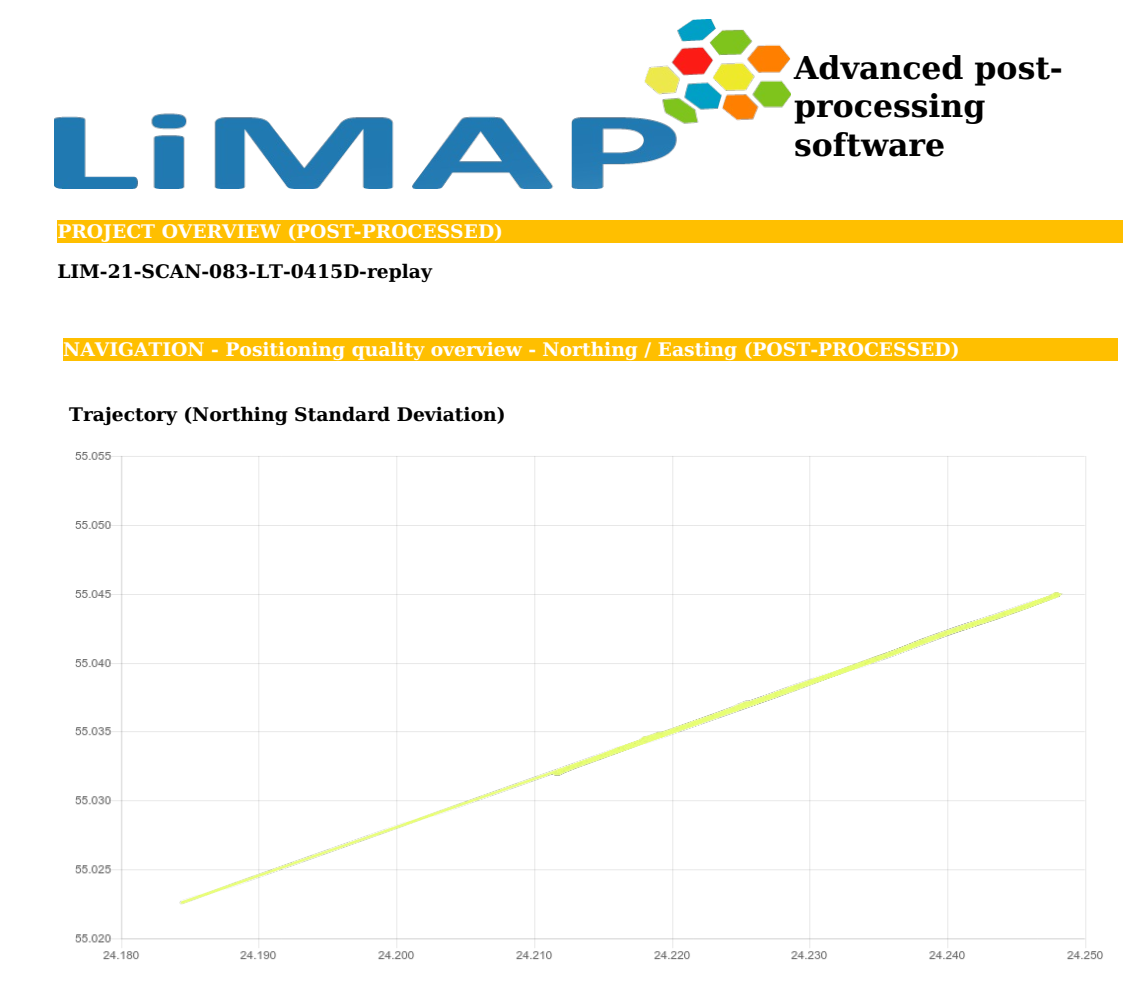
STATE MAIN ROAD A6 25,848 – 26,328 KM, LITHUANIA
Customers of this project: 3 road construction companies before the Yellow FIDIC tender (design and build asphalt resurfacing). These 3 companies are few of the biggest road construction companies in Lithuania. Data was ordered to check asphalt, required to level road volume scope before tender. Location: This project is located in the middle of Lithuania. WGS84 coordinate – 55.0405, 24.2242
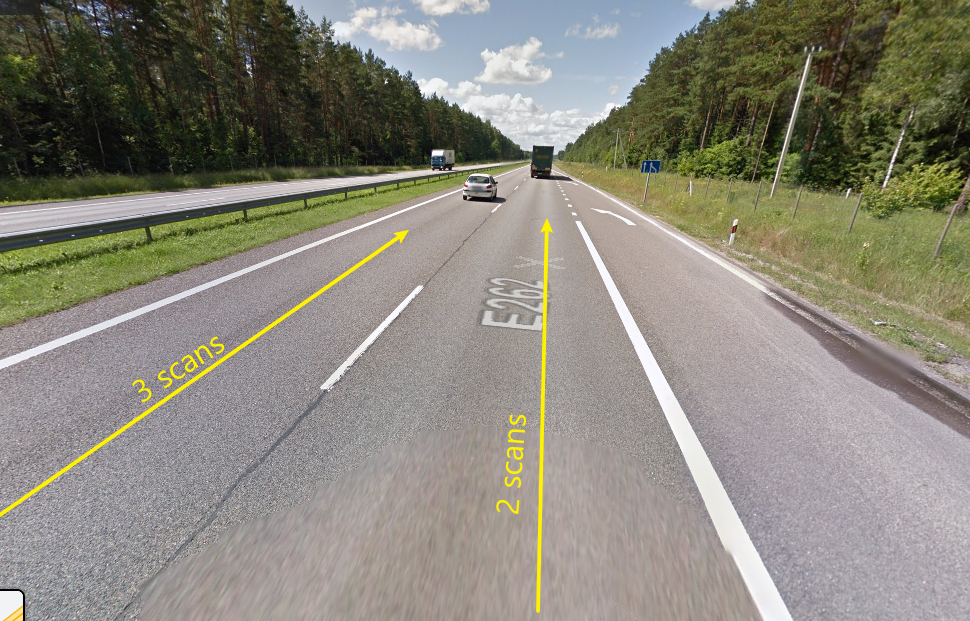
Situation description: length of project is around 1 km. On both sides of the road there is high forest, but basically a lot of satellites were available.
In this project we have done 5 scans, 5 forward and 0 backward.
Base station: was used as a VRS base station, which can track GPS and Glonass signals. Distance to the base station was up to 1 km.
For this task we have chosen a levelling method combined with RTK solution. It was extremely important to get the best results in elevation. We used a Leica sprinter 250M. Levelling points were marked with paint on asphalt every 50 m by sections 1 point in each roadside. Leveling was done in both ways Forward and Backward. Final accuracy was reached 0 mm on elevation. To measure XY values, a GPS unit was used.
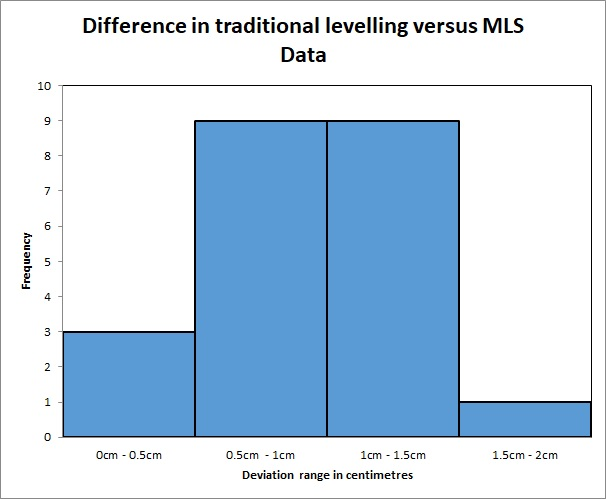
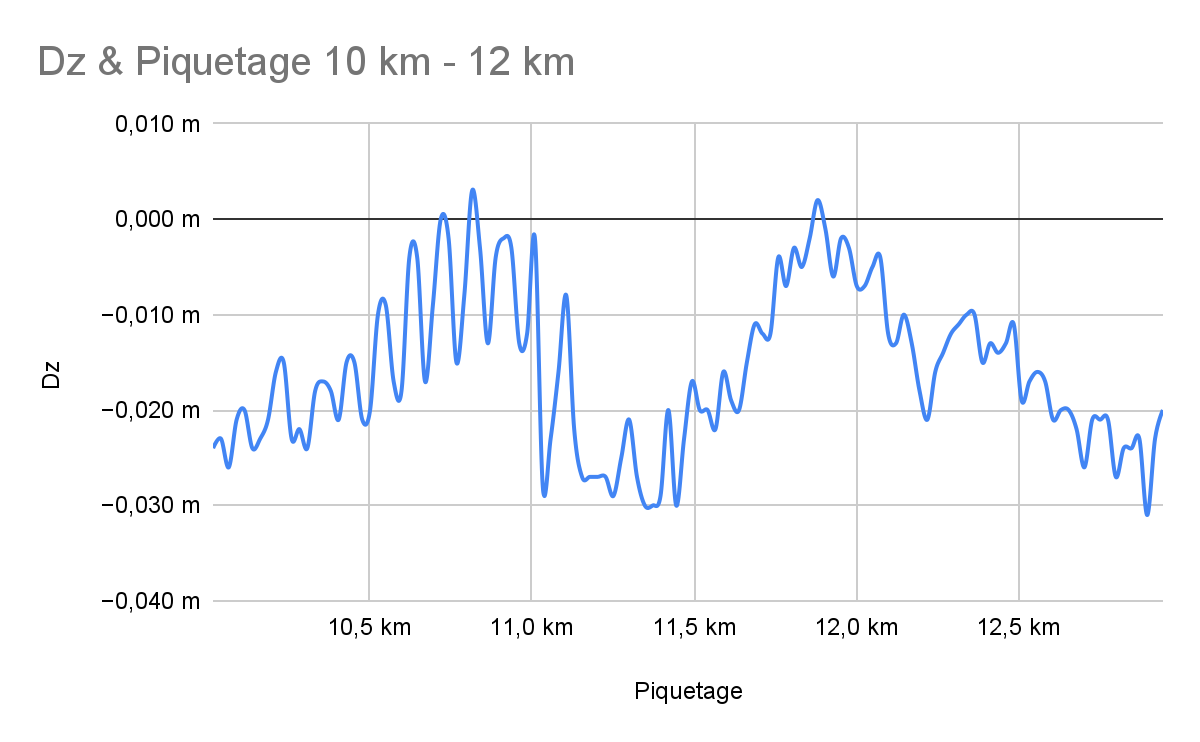
After comparing results between leveling and MLS got results:
Average dz +0.010 Average magnitude 0.010
Minimum dz +0.003 Root mean square 0.011
Maximum dz +0.016 Std deviation 0.004
If MLS data was shifted by distances ((16 mm+3 mm)/2=9,5mm) in +9,5 mm, MLS data accuracy was +-6,5mm.
On this project we reached high accuracy and precision, even without using CP. Even when we get good results, for resurfacing projects we need to combine MLS and levelling data.
To eliminate MLS data accuracy (interval from+3 mm to +16 mm) we are using leveling points to get precise data. In specialized software MLS data and leveling data are matching, making corrections for LIDAR data.
After combining results MLS and leveling data, report:
Average dz -0.000 Average magnitude 0.002
Minimum dz -0.003 Root mean square 0.002
Maximum dz +0.003 Std deviation 0.002
CONCLUSION ABOUT THE RESULTS
The results of this study demonstrate RAW (not corrected with control points) MLS data results:
- In very small road scan projects up to 1 kilometer, accuracy range is +-10mm.
- In longer road scan projects, accuracy range is +- 33 mm per ALL project. In the worst cases seen here it would be +-15mm per 1 kilometer.
- In shorter road scan projects up to 3 km, accuracy range is +-15mm per ALL project. In the worst cases seen here it would be +-15mm per 1 kilometer.
100% of all LiMAP projects are matched between 2 – 6 scans. It’s additional security to get data in high quality and maintain selfcheck procedures. As we see from the results, comparing traditional methods CP and MLS data, especially on longer distance projects we get similar errors. Collectively, our results appear consistent with the geoid model we use for the project. I.e. in this project the geoid model has 5 cm accuracy, so we can assume that this 5 cm error can cause elevation data especially on bigger distances like 15 km and more. The only method to eliminate it, is levelling longer projects.
This MLS data analysis shows us that MLS services can fit the highest quality standards for road design, construction and other engineering tasks.
IF YOU WANT TO KNOW MORE, CLICK HERE AND CHECK FULL REPORT